FINANCING CIBA
The reader is asked to consider the nature of Ciba-Giegy's business and assets, and to answer four important questions about its financing. Excerpts from the 1992 Annual Report give a basis for answering the questions. I have rephrased them and offered hints as to how they should be answered.
(1) What is Ciba's debt-to-equity ratio, and what might one advise the company about what it should be?
From the December 31, 1992 balance sheet, Ciba's total assets of SF30.6 billion are financed by SF18.1 billion (59.2%) of equity and SF12.5 billion (40.8%) of debt. The following considerations help us judge whether this is optimal:
|
Consideration |
General |
In Ciba's case |
|
Tax shield |
Interest on debt is tax deductible, so more leverage is better, other things being equal. |
Ciba is profitable, and has been so since 1982, so it needs as much of a tax shield as it can get. |
|
Risk of financial distress |
Volatility of operating earnings increases probability of bankruptcy, which involves out-of-pocket and other costs. |
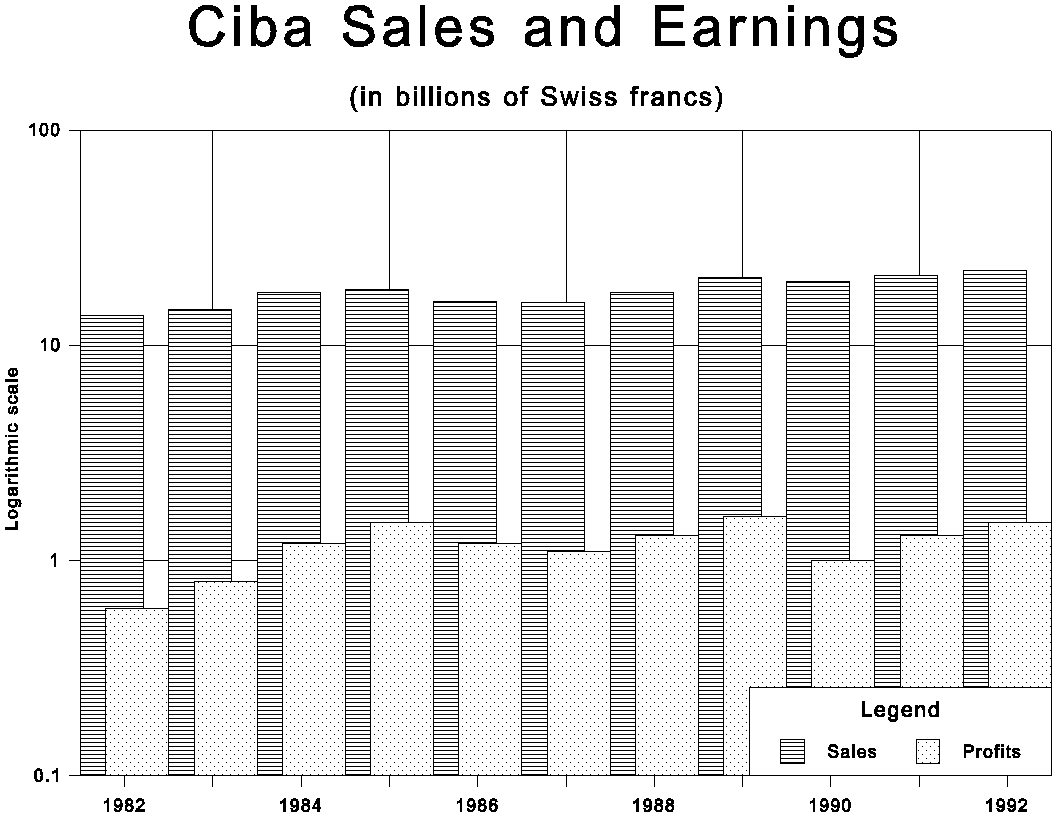
Ciba's earnings are diversified (health care, agricultural and industrial chemicals and materials) and relatively stable (see chart below), unlike some large, capital-intensive firms. Thus it can tolerate more debt. |
|
Intangible assets |
Firms with intangible assets such as reputation, patents and human capital suffer greater losses when under financial stress. |
Ciba relies heavily on research, reputation, and ongoing customer relationships, much of which could be lost if bankruptcy threatened. |
A chart of Ciba Groups' sales and earnings indicates reasonable stability, an indication that a higher proportion of debt may be tolerable:
Although these factors cannot be quantified, it seems likely that Ciba could cope with more debt, making shareholders better off by having a greater tax shield.
(2) How much of Ciba's debt is fixed-rate borrowing, and should this proportion change?
Based on the footnotes to the Consolidated Balance Sheet, less than 40% of the company's debt is fixed-rate debt, since all short-term and some of the long-term debt is floating. According to the principles laid out in the chapter, companies should use floating-rate debt to finance bank-like assets, such as accounts receivable, while fixed-rate debt should be used for ongoing operations unless the level of earnings is correlated with the level of interest rates. This suggests that a company like Ciba should have a larger proportion of fixed-rate debt.
(3) How much of the company's debt should be long term?
Long-term debt is used to hedge "access" or "availability" risk; too heavy dependence on short-term financing like commercial paper can add unnecessary risk of being short of funds just when they are needed most. For example, long-term debt should be used to finance assets such as plant and equipment and research and development. In 1992, Ciba had fixed assets of SF13.9 billion and capital expenditures of SF1.9 billion. Yet the majority of Ciba's debt is in the short-term commercial paper, bank debt, and suppliers-credit markets. This suggests that if the proportion of debt financing as a whole is increased, much of it should be in the form of long-term debt.
(4) What is the composition, by currency of denomination, of Ciba's debt? What should it be?
The currency of denomination of debt should match the currency of the company's economic exposure, in order to minimize the risk and cost of financial distress. Hence the starting point is to estimate what proportion of Ciba's debt is in U.S. dollars, Swiss francs, Japanese yen, and other currencies. We can guess the proportions on the basis of the following information:
· Geographic location of sales and capital assets. While 43% of sales are in Europe, 68% of capital assets are in Europe, mostly in Switzerland. 32% of sales are in North America, but only 23% of capital assets.
· Currency distribution of sales. Using the "Sales in the principal local currencies" table in conjunction with the "FT Guide to World Currencies" in Chapter 4, Application 4.1, we obtain the proportions in each currency.
|
|
Sales in local currency (millions) |
Exchange rate |
Sales in U.S. dollars |
Proportion by currency |
|
USA US$ Germany DM UK £ France Franc Italy Lira Japan Yen Spain Peseta Canada C$ Brazil US$ Switzerland Franc Mexico Peso Australia A$ Netherlands Guilder Belg./Lux. Franc |
4,651 2,409 428 6,553 1,023,641 122,699 43,177 476 406 435 759,829 320 538 7,266 |
1 1.6366 0.6514 5.5097 1486.02 110.261 124.658 1.2631 1 1.4706 3.1146 1.4416 1.8322 33.6482 |
4,651 1,472 657 1,189 689 1,113 346 377 406 296 244 222 294 216 |
38.2% 12.1% 5.4% 9.8% 5.7% 9.1% 2.8% 3.1% 3.3% 2.4% 2.0% 1.8% 2.4% 1.8% |
· Nature of the company's businesses, and the relative importance of each. Ciba's business portfolio is diversified, with chemical process, inorganic as well as organic, as the common denominator. Much of the agricultural and industrial chemical business in Switzerland, the rest of Europe and elsewhere is dollar-denominated, in fact if not in form. These product lines constitute 61% of the total. The pharmaceutical business, on the other hand, is often priced locally in the context of national health care systems. Ciba's report describes it as "a highly fragmented market."
Although Ciba's 1992 Annual Report does not give a detailed breakdown of the currency of denomination of debt, one can ascertain certain facts from the footnotes to the Balance Sheet.
Putting these together, we can construct a table that estimates the desired and actual proportion of debt in the major currency groups, and make some tentative recommendations.
|
|
Geographic distribution of |
Currency distribution of sales |
Remarks on economic exposure |
Estimated currency distribution of debt |
|
|
|
Fixed assets |
Sales |
|||
|
Switzerland |
41% |
} 79% |
2.4% |
Net short position because much of production, but little of sales, here |
9% |
|
U.K. |
} 27% |
5.4% |
Part of sales effectively U.S. dollar denominated |
7% |
|
|
Other Europe |
34.6% |
21% |
|||
|
U.S. and Canada |
23% |
32% |
41.3% |
|
54% |
|
Latin America |
4% |
7% |
5.3% |
Most of sales effectively dollar denominated |
2% |
|
Asia |
4% |
13% |
10.9% |
Part of sales effectively U.S. dollar denominated |
6% |
|
Rest of the world |
1% |
5% |
|
Most of sales effectively dollar denominated |
1% |
From this table we may guess that currency-matching may require less Swiss Franc debt, more non-Swiss franc, non-sterling, European-currency debt, and possibly more Japanese yen and U.S. dollar debt.